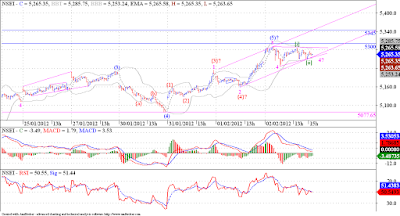
Nifty is sporting 3 different possibilities, two bullish, one bearish. Lets discuss them one by one.
A. Bullish case 1, we might be extending in wave wave 5 of {3}, and we get target for wave {3} around 5400 levels.
B. Bullish case 2, wave 4 of {3} may be forming a triangle and target for wave {3} may be around 5350.
C. Bearish case 3, a low probability expanding diagonal may have completed at (5) as shown in the chart and we will have to tank below the wave {4}at 5159.20 to confirm the count.
I am looking for an extension of wave 5 of {3} or a triangle in wave 4 of {3}, and according to the two preferred cases we might get some more upside may be around 5350 - 5400 levels.


Hi Aniruddha,
ReplyDeleteUr lables r excellent!
One more angle for Analysis - CANDLES!
1. WEEKLY CANDLES: Prev Real Body Tops / Closes come @ 5300-5310-5366
THESE LEVELS WILL RESIST UPMOVE
2. EOD candle has formed a DOJI.. indecision!
If tomo close is BELOW today's close EOD, then we may say wid some assurance that we r in wave 4 of the IMPULSE from 4532.
Keep up the good work & do tell ur exp wid Amibroker... I am keen to explore
rgds
Shriram Oak
Thanks for your encouragement. I follow candles too, but publish only my EW analysis on Bar Charts. Your observation of Doji on EOD charts is accurate. But what is more important is the inference you draw from them, you can spot several other instances where Doji, Hanging Man etc were formed in this up move from 4532, but the market went one way, UP. Now a Doji formed after a sustained up move may prove to be exact turning points but beware of relying too much on Candle formations, I suggest you use other analysis tools along with candle patterns to trade the markets.If we trade above 5270 we are likely to see at least 5350 on Nifty.
DeleteAmibroker is excellent.
If you are benefited from free and accurate
ReplyDeleteanalysis posted in
nayakKirankumar.blogspot.com
please share the link among your contacts and let
every one make money.
God bless all