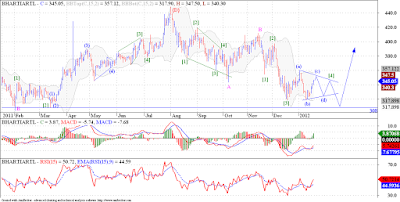
This is a daily chart of Bharti. I have marked wave {D} in the middle top portion of the chart. This {D} is actually second last wave of a triangle. This triangle has been forming since 2007, so one can say that Bharti was in consolidation since approximately 4 years. Now wave {E} must be a 3 wave structure, and we can see that we have already completed waves A and B, now forming wave C of {E} of (IV). We might form a triangle in wave [4] of C of {E}. Once this wave [4] and [5] are done we will get a sharp thrust which will be coming out of a 4 year long triangle. So it will be worth waiting for.
Tuesday, January 17, 2012
Bharti on the verge of completing a 4 yr long 'Triangle Pattern'!
About Dean Market Profile
Dean is a fulltime trader for last 13 years. He is passionate about technical analysis. His instruments of choice are Nifty and banknifty futures and options. His main analysis and trading tools include advanced techniques like Market Profile, Voilume Spread Analysis and Order FLow Analysis. Dean is a teacher at heart and loves sharing his learnings with committed traders. You can check out his courses here...
Newer Article
Tata Steel zigzag is over, unless its a different pattern, we are going up!
Older Article
Infosys may rally close to all time highs, don't believe it, read on!
Tata Motors - Technical UpdateJun 04, 2013
Nifty, Banknifty, Infy - Technical UpdateMay 30, 2013
Rcom - Technical UpdateMay 23, 2013
Idea - Technical UpdateMay 22, 2013
Subscribe to:
Post Comments (Atom)


No comments:
Post a Comment
...I am thrilled to learn what you think about this piece of content...