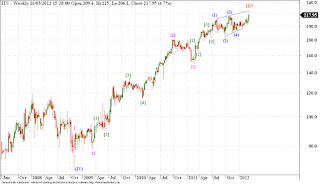
ITC has been in a persistent uptrend, for quite some time now. Its really difficult to place wave markings on such charts, but looking at the price pattern developing for last year we can spot an ending diagonal. Now ED have some specific implications, one is that prices stage a sharp reversal once the pattern is complete. Now ITC rallied smartly today, and made a new high on a favorable Budget announcement. But today's spike may prove to be the last gasp before ITC tanks, and tanks big time. Now I may be proven very wrong, but thats the risk we have to take. For if we are right in picking this pattern then the reward will be well worth the risk. Let us see whats in store for us.
Friday, March 16, 2012
ITC - Elliott Wave Analysis
About Dean Market Profile
Dean is a fulltime trader for last 13 years. He is passionate about technical analysis. His instruments of choice are Nifty and banknifty futures and options. His main analysis and trading tools include advanced techniques like Market Profile, Voilume Spread Analysis and Order FLow Analysis. Dean is a teacher at heart and loves sharing his learnings with committed traders. You can check out his courses here...
Stocks
Subscribe to:
Post Comments (Atom)


Aniruddha Ji,
ReplyDeleteany update on this after today's move?
If we sustain above 230 levels then This count will have to be revisited.
Deletethanks Aniruddha ji- hourly TA has become bearish.. daily is still buy... lets see... witnessed very high acitivty in ITC options
ReplyDeleteI am not good in reading options stats, but the 230 level is critical, so once we trade above 230 then we have to revisit our count.
Delete