
Price Action trading is one of the oldest art forms of trading. I am purposely calling it art because even though it may seem very technical at the end of the day you have to develop a feel for all these patterns. The better the feel better will be your results with these price action patterns.
Knowing these patterns will not be sufficient, you have to put in a lot of deliberate thought into how you are going to trade each one of them. Always remember, the better and clearer your plan better will be your decisions during live markets.
If you jump into trading without a plan without a sound framework then you will only suffer losses. And then keep wondering why these patterns don't work. Having a well-defined trading plan can incorporate these trading strategies into it, seamlessly.
So just nailing the trading strategies won't be enough, you will have to work on a wholesome trading plan, which will guide you in every aspect of your trading. But for this piece, we are going to look at a few popular but effective price action patterns and a few rules around them to avoid the common pitfalls.
Knowing these patterns will not be sufficient, you have to put in a lot of deliberate thought into how you are going to trade each one of them. Always remember, the better and clearer your plan better will be your decisions during live markets.
If you jump into trading without a plan without a sound framework then you will only suffer losses. And then keep wondering why these patterns don't work. Having a well-defined trading plan can incorporate these trading strategies into it, seamlessly.
Trading Strategies vs Trading Plan
Trading Strategies are quick and short plays in the markets when markets meet certain criteria, which we often refer to as setups or patterns. Whereas trading plan is a wider term with a slightly bigger scope. It includes along with the strategies, psychology, risk management, trade management, et al.So just nailing the trading strategies won't be enough, you will have to work on a wholesome trading plan, which will guide you in every aspect of your trading. But for this piece, we are going to look at a few popular but effective price action patterns and a few rules around them to avoid the common pitfalls.
Common price action trading strategies and patterns...
- Trendlines and Channels
- Bullish and Bearish Flags
- Pennants
- Wedges and Diagonals
- Narrow Range Bars and Inside Bars
- Support and Resistances
- False Breakouts and Breakdowns
- Measured Moves
- Wyckoff Springs
- Head and Shoulders
1. Trendlines and Channels
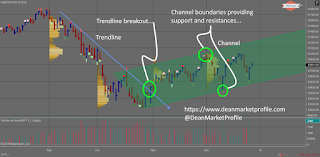
One of the first tool traders use to analyse the markets is a trendline. A rising or a falling trendline shows which side is dominant in the markets at any given point in time. It pays to trade in the direction of the dominant trend. A trend line is drawn by joining rising lows in case of an uptrend and falling highs in case of a downtrend.
A trendline also serves another important function, it alerts the traders when the trend might be weakening or even reversing. To enhance this aspect of the trend lines, especially the trend weakening part, traders started drawing a trend channel.
Trend channel is a special case of trend line where we drop a parallel trend line across the tops in case of an uptrend line and across the lows in case of a downtrend. This parallel line gives us the likely targets for the moves in the direction of the trend.
The charts below discuss how best you can exploit the trendlines...

2. Bullish and Bearish Flags
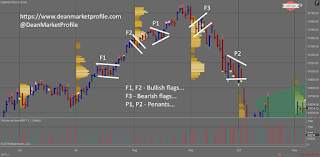
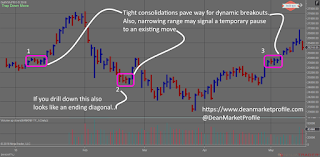
A trend is never a straight line. The trend can be dynamic for a short period of time, but eventually, it has to halt and catch its breath. Once the traders have had an opportunity to balance their inventories, it begins with renewed force.
These moments where the trends pause for a while usually take the shape of tight consolidations slanting slightly against the main trend. Also, they provide some of the best opportunities to jump onboard an existing trend.
Ironically the same structure which tells us about the strength of the trend also warns us when it might be nearing an end. They are often termed as final flags, which happen just before the trend ends and changes direction. It is a great feeling when we are able to spot one.
The charts below explain flags in greater detail...

3. Pennants or Triangles
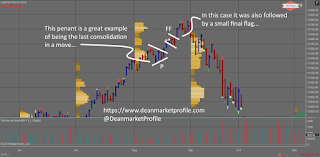
Pennants are similar to flags and more often than not precede the last move in a trend. The Elliott wave principle states that this type of consolidation, triangle or pennant shaped, usually occurs in the 4th or B waves. Both these waves are followed by the last move in a trend or countertrend for that matter.
They represent a pause in the trend and trend resumes once this pattern is complete. The charts below show some examples where you can spot this pennant or triangle pattern...

4. Wedges and Diagonals
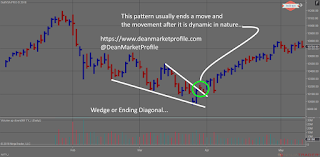
Wedges show up when the trend is in its last leg. Usually, the correction following a wedge or a diagonal is swift and sharp and the sudden increase in the volatility surprises everyone.
Diagonals are similar to wedges, but they can appear in two places as per Elliott wave theory. Since Elliott wave theory uses many standard patterns, they use diagonal too. As per this principle, a wedge or diagonal can appear as a wave 5 that is the last wave in the trend and sometimes as wave 1 at the very beginning of the trend.
Where it appears will help us decide the proper course of action post its completing. Look at these charts below to get a grip on these patterns...

5. Narrow Range Bars and Inside Bars
Along with the trend, there is another property of the prices that move in cycles. That is volatility. Like an uptrend is followed by downtrend, periods of high volatility are followed by periods of low volatility and vice versa.
Narrow range bars and inside bars are an example of low or contracted volatility. And when markets make big progress in a short period of time, via wide-ranging bars and gaps, we have high volatility in the markets.
The funny thing is if you can learn to sit quite during these periods of contracted volatility, then you can make a lot of money during the periods of high volatility.
Let's look at a few charts that explain this point in greater detail...

6. Supports and Resistances
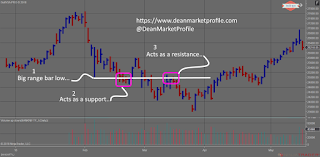
This behaviour of price is very well known. Prices move directionally when either the buyer or seller is the dominant party. But whenever they become equals markets move sideways. Also, when the prices are trending up, buyers gradually become weak and sellers gradually become strong, and the scales tip at some point.
As soon as this happens, we see a trend change in the markets. These points where the buyers overcome sellers or vice versa. Or those extended periods of sideways movements where the buyers roughly match sellers often act as supports and resistances.
That is if the price approaches these areas from above they will act as a support and when they approach from below they act as a resistance. If you know what you are doing these areas of support and resistance is a goldmine of opportunities.
Look at the following examples for a better understanding of support an resistances...


7. False Breakouts and False Breakdowns
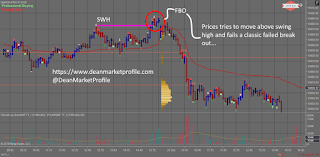
False breakouts and breakdowns is a topic closely related to supports and resistances. The idea is as traders try to break out of consolidation above resistance or support, they need the participation of smart traders.
if the big money is not supporting a breakout or a breakdown, it is likely to fail. What happens is traders rush into the markets as soon as prices breakout above the resistance, but when they realise that the smart money is not jumping in to support the breakout, this move fizzles out.
This is usually followed by a sharp move in the other direction, as all the trapped traders rush to get out of their positions. This quick move is what gives it the glamour. While it may seem a relatively easy pattern to trade, in live markets it is often surrounded by a lot of confusion and indecision.
Let's look at a few examples...


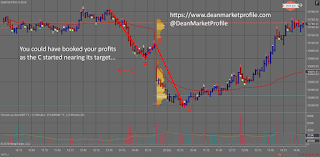
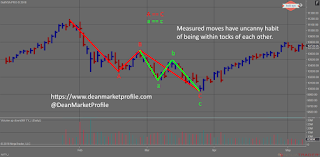
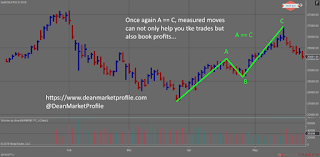
8. Measured Moves
Measured moves are often seen when the price makes a dash in one direction and is followed by a tight but shallow correction, something like a flag or a pennant. usually, this suggests that on the first dash by the price many traders rush in to book their profits looking at the quick gains they have made.
But the smart money has different plans, so they absorb all the selling or buying that comes in the markets. Once the selling or buying subsides the trend resumes and usually completes at least another leg in the direction of the original dash.
What is typical though is the property of the prices to move in the second leg by an amount approximately equal to the first leg. This property has been exploited by traders over the years. What they do is simply measure the initial move and project it from the brief pause the markets have taken.
That is why it is called as a measured move, an example will clear a lot of things...


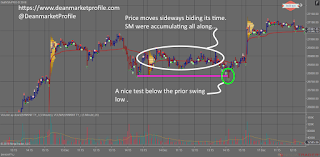
9. Wyckoff Springs
These are similar to the false breakout and breakdown we saw just a few paragraphs ago. But I am covering it separately because it is one of my favourite patterns. This pattern also has parallels in the Elliott wave theory, where they may appear as expanded flats.
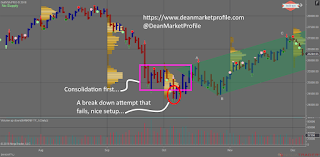
Usually, a trend pauses and prices move sideways because some of the early birds are now booking profits. Say in case of an uptrend, this sideways move creates a consolidation, rectangular in shape sometimes. That is when the spring might appear.
What happens is traders, buyers in case of an uptrend, briefly mark the prices below an important pivot point or reference (such as the lower boundary of a rectangular consolidation). When they discover that no more selling is coming in they are sure that most of the profit booking traders are out of the markets and then they can mark the prices up freely...
These are very potent patterns if you include them in your trading plan you can spot some great low-risk opportunity with the possibility of a big reward. Look at the following examples...
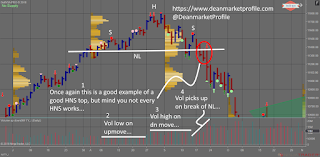
This is the most common mistake traders make while observing these patterns, ignoring how the volume is behaving during the pattern formation. A closer look at volume will reveal the hidden intentions of smart traders.
One common mistake novice traders make is to only look at the successful head and shoulder patterns. Remember, many tops are head and shoulders but not all of them. Beginners only spot the clean head and shoulders at a prominent top but miss multiple patterns that did not work out so well. That is the confirmation bias at play, only finding evidence that supports your case.
Look at a few examples good as well as bad ones of this evergreen pattern...
Then all you are left with is to track your behaviours against the benchmark of your trading plan. It makes a world of difference when you have a strong trading plan filled with great time-tested trading strategies beforehand.
So go ahead and use these 10 price action trading strategies and incorporate them into your trading plan. As always if you feel the need to discuss any of the above strategies or patterns you can drop in a comment and I shall get back to you asap...
I am sure you will find this content useful to many of your friends and colleagues, so go ahead and share it on your social networks because...

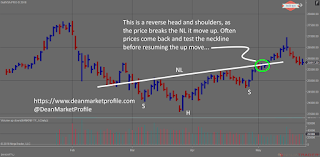
10. Head and Shoulders
There is no trader who has been watching price and has not heard about this one. This is arguably one of the most popular and most followed patterns, come is close second the double tops and bottoms. But as with any pattern, the key to success is how the volume plays when the price is doing its thing.This is the most common mistake traders make while observing these patterns, ignoring how the volume is behaving during the pattern formation. A closer look at volume will reveal the hidden intentions of smart traders.
One common mistake novice traders make is to only look at the successful head and shoulder patterns. Remember, many tops are head and shoulders but not all of them. Beginners only spot the clean head and shoulders at a prominent top but miss multiple patterns that did not work out so well. That is the confirmation bias at play, only finding evidence that supports your case.
Look at a few examples good as well as bad ones of this evergreen pattern...


Conclusion
These 10 price action patterns and trading strategies have stood the test of time. You can use them in your trading plan. The main benefit of using such time-tested strategies is that you can build the best behaviours around these strategies. A list of dos and don'ts if you will...Then all you are left with is to track your behaviours against the benchmark of your trading plan. It makes a world of difference when you have a strong trading plan filled with great time-tested trading strategies beforehand.
So go ahead and use these 10 price action trading strategies and incorporate them into your trading plan. As always if you feel the need to discuss any of the above strategies or patterns you can drop in a comment and I shall get back to you asap...
I am sure you will find this content useful to many of your friends and colleagues, so go ahead and share it on your social networks because...


No comments:
Post a Comment
...I am thrilled to learn what you think about this piece of content...