Monday, April 30, 2012

Nifty - Elliott Wave Analysis


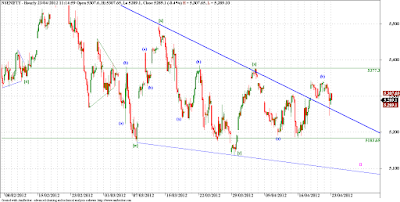
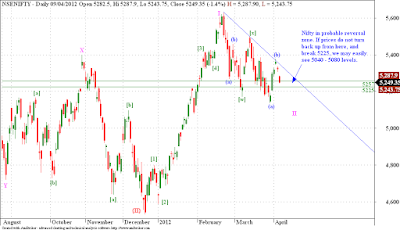
Nifty triangle count will get confirmation once we break below the low marked by wave (a) on the chart, the level comes around 5160 levels. The stochastic is at overbought levels, and turned down. So if our count is right, then once this corrective move is over, we may see prices continuing down from these levels. Resistance may come at 5280 - 5300 levels. the corrective pattern forming is of the Flat variety, so once this wave {c} of (b) is done, we will see the down move continuing.

Friday, April 27, 2012

Idea - Elliott Wave Analysis


Bharti Chart left some doubts, but Idea chart has helped clear the clouds. We can see a good triangle forming on Idea chart, and since triangles are patterns mostly seen in 4th waves and B waves, we can expect either a 5th wave or a C wave following a triangle. Both 5th and C waves are motive waves, and most likely impulses, atleast the sub waves of these waves are going to be impulses. So on a shorter time frame Idea needs to complete another round of selling towards the 71.50 levels before we ca n call and end to this corrective move. Consequently we should rally in wave {III}, and technically should atleast reach the top of wave (III) or (A). That augurs well for this stock and once the expected last wave of selling is done we should resume the up trend. The invalidation points for this count are 71.50 and 63.00, below which the stock should fall much much more. But remember, one more round of selling is pending in this stock.

Thursday, April 26, 2012

Bharti - Elliott Wave Analysis


Bharti is offering a dual interpretation. Both are triangle patterns, but one cant be too sure about whether it is a wave (IV) triangle or a wave {B} triangle in wave (IV). Interesting!! We can spot the wave labels without the question mark behind them, that is my preferred count. One which suggests that we are in wave {E} of (IV), and prices should zoom once we are through with wave {E}. But the one with question marks is the alternate count which suggests that the triangle was actually in wave {B} of (IV), and prices should come down in wave {C} of (IV). The decider is actually the first wave down, marked {A}, it is clearly corrective, and can easily be the first wave of a triangle wave (IV), and in that case we should soon see prices zooming up, the failure point for this count is of course the low of wave {C}at 252. Right now I wont bet on prices falling too much, at least not below the lower boundary if the wave (IV) triangle (thick blue line). However if we get resisted at the red line and start falling again, we may see much lower prices in times to come.

Ranbaxy - Elliott Wave Analysis


Ranbaxy rallied smartly, but it was a [c] wave of an intermediate X wave, atleast that is what a plausible wave count would suggest. If it is so we can expect another 3 wave downmove in Ranbaxy. The level of 525 is all important for this scrip, it marks the 61.8% retracement of the previous 3 wave correction. And prices are getting resisted at this point. If we break above this level of 525, we may see prices rising to another resistance level of 570. Above which a new uptrend will be definitely confirmed. But should prices start falling from here, we have two very important supports which should be respected if upmove is to resume from here. Those are 445 - 425. If we break below this then we are sure to see much lower levels on this scrip. If Ranbaxy closes below the 5 day EMA, a short term reversal can be expected, and such a downmove will be violated only on a close above the recent high of 532.40. So above 532.40 we have a target of 570, and on a close below 5 day EMA we may see 445 - 425 range. My bets are on a fall in prices. 

Nifty - Elliott Wave Analysis

The minimum requirement for this corrective pattern to complete is 5135. But if we go by the triangle in wave [b]/[y] interpretation then we may see even lower levels, around 4950 - 4920 range.We have broken the b - d trend line which suggests that the triangle pattern may be completed. watch out for 5100 as critical support.

Monday, April 23, 2012

Nifty - Elliott Wave Analysis


Elliott Wave Analysis is based on pattern recognition, and then following a set of well defined rules to trade those patterns. Corrective patterns are basically 3 wave structures, but are seldom as simple as 3 waves. they take on myriad of shapes and often extend in duration and complication. We are dealing with one such corrective wave. and after today's price action we can spot a contracting triangle in wave [b]/[x] of wave II. Triangle are continuation patterns, but under EWT they are the patterns which precede last leg of any movement. In present case this triangle may be followed by a sharp fall, which will be wave [c]/[y] of wave II. And once this sharp fall in done, we may see end to this wave II. According to above count the target for wave [c]/[y] may come around the 4950 - 4920 zone.Watch for support around 5135 - 5100 - 4950 - 4920 levels.

Nifty - Elliott Wave Analysis


Nifty is trapped in 5380 - 5180 range. An alternate labeling can be seen in the chart. Now where Nifty will go depends on which side the market breaks out or breaks down from this range. The pattern is confusing at this moment, so wait and watch is the best route to follow.

Thursday, April 19, 2012

Nifty - Elliott Wave Analysis


Nifty has sustained above the falling trend line for two days now, we are seeing sharp rise and sideways consolidations, such a price behavior is observed when we are in or about to begin persistent uptrend. Classical technical analysts would say that the correction has ended post trend line breakout, and I personally believe that it indeed has ended. now we should see rices rallying with intermediate resistances coming at 5380 (crucial), 5500 and 5535 (very crucial). Once through this band of 5460 - 5535 we have clear blue skies above, and hopefully we can soar even higher with our wings spread wide.

Wednesday, April 18, 2012

ACC, Ambujacem - Elliott Wave Analysis

Two cements stocks look interesting.
ACC - uptrend above 1350.
Ambujacem - uptrend above 172.50.

Good Luck
Aniruddha
Sent from my LG Mobile

Tuesday, April 17, 2012

Nifty - Elliott Wave Analysis


Nifty staged a smart rally after the favorable action on the part of RBI. It has very slightly closed above the falling trend line. Last time it breached the trend line but failed to close above it. So if we sustain above this falling trend line for a couple of days, then we might see extended move in upward direction. If we get resisted at this trend line again then we are sure to see levels around 5100 - 5040 again. We have to wait and watch what happens now.

Monday, April 16, 2012

Nifty - Elliott Wave Analysis


Nifty is showing a couple of possibilities. And as usual both the possibilities are equiprobable, and depend heavily on what RBI has in store for us. If RBI do cut rates, we might see markets responding positively. Above 5300 and 5330 range, we might see sharp rally in Nifty. But if we get resisted below this range, the we may go all the way down to test the 5135 low, to complete the TZZ pattern. The falling trend line will also provide a credible entry point for participating in the up trend.

SBIN - Elliott Wave Analysis


SBIN completed its 5 wave impulsive advance around 2465 levels. From there it is falling in a corrective fashion. It seems SBIN has completed a clean 3 wave down move and is rising again in the main trend. At a minimum we must cross the 61.8% of this corrective move to ensure that we have completed the 3 wave corrective down move. So above 2310 we must see even higher prices, atleast till 2465. If wave II is done as shown in the chart, we are rising in new impulsive move. Also we have broken and closed above the falling trend line, which is also a signal of strength. Tomorrows rate cut rumor might just materialize.

Saturday, April 14, 2012

Nifty - Weekly Wrap Up


Nifty completed the wave (a) which started last week after we got resisted at 5380 levels. The wave (a) took support around 5200 levels and staged a smart rally to complete the wave (b) just around the falling trend line. Yesterday's fall was dramatic, and was fueled by the poor results and performance of IT stocks giant Infy. We expect the price to move down further from these levels, and should head for the region of 5100 - 5075 levels. This band should provide some clue as to the future direction of this move. Our Elliott wave count suggests we are falling in wave (c) of  [z] of  II. If prices take support at the 5100 - 5075 zone, and lowest at 4950 levels then we can resume the up trend, but if we break down from these levels then this bullish count has to be revisited. Minimum target for this downmove will be below 5135, to complete the pattern.

Friday, April 13, 2012

Infy - Elliott Wave Analysis


Infosys has tanked following bad results. On a larger time frame we can see a zigzag correction taking shape. Infy has been falling hard on last few results days. Today to it continued the tradition. The 61.8% retracement comes around 2000 levels for Infy, thats a good 400 points below from current levels. Also Nifty may be falling in the last leg of correction, this last leg of the fall will be led by It stocks it seems. But as night is followed by day, corrections are followed by impulses. Just wait patiently for these corrections to end and then enter into the next impulse with conviction. Your patience will be rewarded.

Nifty - Elliott Wave Analysis


Is it possible that we might trace out a triple zigzag (TZZ) correction, in wave II. Given the fact that we traced out similar correction in wave {II} of one larger degree. This phenomenon has been observed consistently, where 2nd and 4th waves at different degree tend to form similar patterns. If it is so we may come down all the way to 5100 - 5075 range to complete the third leg of this triple zigzag. This sharp fall in last few minutes may be an indication which gives additional support to our TZZ argument. So we should be looking for some reversal patterns around 5100 - 5075 range to enter on the long side. 
Prices are still meandering in the range of 5350 - 5100 mentioned in earlier post.

Thursday, April 12, 2012

Nifty - Elliott Wave Analysis


Nifty is close to the falling trend line (blue color), if we break out above this falling trend line, we may say that the correction is over and the least target for this upmove will be in the range of 5400, and if this is the starting point of this new move then we will see much higher prices in coming days and weeks. No we just have to wait and see if we take resistance at this trend line or just break through above it.

Wednesday, April 11, 2012

Nifty - Elliott Wave Analysis


Nifty gapped below the support zone of 5225. But taking a look at the larger picture we can clearly spot a cluster zone, forming over a period of last 15 months or so. This cluster zone has repeatedly provided prices with support and resistance, and we are currently in this zone. Also we are forming a corrective pattern after completion of a sharp impulsive pattern. All in all we must be patient in this meandering phase, and unless you are very good at following prices on short time frames, you should sit this one out till prices clear the cluster zone in either direction. Looking at price patterns Nifty is setting itself up for a big move.

Monday, April 09, 2012

Nifty - Elliott Wave Analysis


Nifty is sharply down today. An alternate labeling can be used. Our earlier count suggested that we have completed wave II at 5135.95. But if we break below the 5257 - 5225 band, the labeling shown on the chart above will come into play. We may then correct to 5080 - 5040 levels, before a meaningful upmove starts. The falling trend line (blue color) has offered resistance once again, so this TL need to be taken out to confirm an end to this corrective down-slide.

Friday, April 06, 2012

Island Reversal on Nifty

Classical TA will pronounce this as an island reversal. If we do nto fill this gap soon by a rally, we might just see much lower prices from here. But a BO above 5379 high of the shooting star might be very bullish.

Sent from my LG Mobile

Thursday, April 05, 2012

Canara Bank, Karnataka Bank - Elliott Wave Analysis


Canara Bank seems to have completed a 3 wave move down. What followed the 3 wave move was a small 5 wave rally, this is the rally which we are waiting for as Elliotticians. We may have a couple of more days of flat to down price action, which should be followed by a spurt in prices. Interesting is the price development in one other bank chart shown below.


Karnataka Bank is showing same pattern development too. And the implications of the pattern are similar to what we are expecting in Canara Bank.

Infy - Elliott Wave Analysis


Infy is moving sideways in a range of 3000 - 2550. But the internal wave structure of this consolidation lends itself to a typical wave count. Infy completed wave I in late October, the it formed a flat correction in wave II. Since the end of wave II we can count a clear 5 wave structure which I have labeled wave [1]. The resistance level has been tested twice so far, but this time I feel the roof of 3000 wont hold the prices down. This time the breakout will be for real. 


ITC - Elliott Wave Analysis


ITC has clearly moved contrary to our expectations. And whenever this happens, we need to get back to the drawing board. And the new drawing is as shown in the above chart. We I am doing something which has been touted very dangerous by the experienced traders. So today's analysis is just my guess as to the future path of ITC. And in no way constitutes a trading advice. I feel ITC is in its wave V, which has targets around 240 - 250 range. What gives support to our argument is the formation of a triangle in wave IV, which generally precedes the last move of one higher degree. Now this V wave may take myriad of shapes, but I would not advice either buying or shorting this scrip till we get clear evidence of either a top or an extension in wave V. ITC need to be in the watch-list till further clarification by prices.

Nifty - Elliott Wave Analysis


Nifty was correcting in a zigzag fashion, and seems to have completed the correction. According to our EW labels we have completed wave II of {III}. So we are about to begin wave III of {III} the most dynamic phase of the advance. To confirm our view Nifty must take out two resistances namely at 5500 and 5630. Only then we can say with some confidence that we have embarked on the most dynamic phase of any impulse move. The corrective action so far is a bit complex so it can easily extend itself, and continue the slow grind downwards. We have three supports to look for entering on the buy side. 5285, 5255 and 5225. Below 5225 the chances of the correction extending increases. But if we take support at any of the above three levels and resume upwards, we are sure to see a protracted up move spaced with small corrective pauses.