 |
| Hourly Chart |
 |
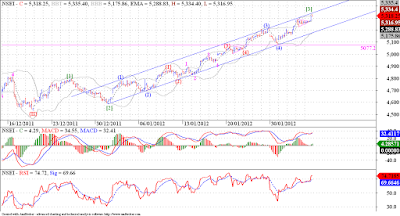
| 10 min Chart |
Nifty selected the triangle scenario out of three we mentioned in yesterday's post. The triangle always precedes the end of an important move. Here we may have completed wave {5} of (5) of [3], as shown in the 10 min chart. The count on lower time frame is changed a bit, as per the developments. We also have reached the upper channel boundary, RSI is overbought. On 10 min chart we have super negative divergence on waves {3} and {5} of wave (5) of [3]. So going by the weight of evidence method, we can call a short term top, and if we break critical levels we may get a bigger and much anticipated wave [4]. Target for wave [4] is around 5075 levels.


No comments:
Post a Comment
...I am thrilled to learn what you think about this piece of content...